Weather Station vs Forecast for Drone Flying: Which Should You Trust?
You check the forecast: 5 m/s. You look at the nearest weather station: 7 m/s, gusting 11. Which one is right? Usually both — they are measuring different things. Knowing what each one describes is what turns the disagreement into useful information.
To see both for your own location, use the free Local Weather Observation vs Forecast tool. It puts the nearest airport report next to the forecast and tells you whether the wind is running stronger or lighter than predicted.
Three different winds for the same place
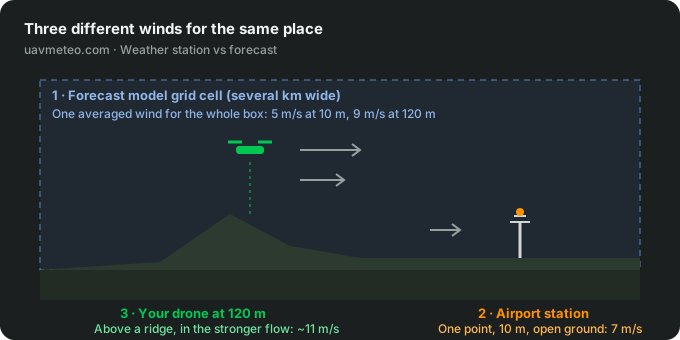
1. The forecast comes from a weather model that divides the world into grid cells, typically 1–10 km wide. The wind it gives you is the model's estimate for the whole cell — an average over hills and valleys, fields and towns. It also has to predict the future, so it can be early or late with a front, a sea breeze or a shower.
2. A weather station measures one point, right now. Official stations — the ones at airports, which publish METAR reports — follow strict rules: the anemometer is 10 m above open, flat ground, away from obstacles, and averages the wind over two to ten minutes. That makes airport reports among the most trustworthy wind measurements you can get for free.
3. Your drone flies somewhere else again: usually higher than 10 m, often near trees, buildings or slopes. Wind usually increases with height, and terrain can speed it up or shelter it. Neither the forecast nor the station measures exactly where you are.
Worked example
FORECAST (your field)     Wind 4.8 m/s   Gusts 7.5 m/s   120 m: 8.2 m/s
AIRPORT, 12 km away       Wind 7.1 m/s   Gusts 10.8 m/s
The station is 2.3 m/s stronger than the forecast — about 50%. What does that tell you?
- The model is running light today. That error rarely stays at 10 m: if the surface wind is 50% stronger than forecast, assume the 120 m wind is also stronger than the 8.2 m/s the forecast shows — perhaps 10–12 m/s.
- The gusts confirm it: 10.8 m/s measured against 7.5 forecast.
- The decision changes: a drone rated for 10 m/s that looked fine on the forecast is now at or over its limit at height.
Without the observation, the forecast alone would have led to a flight at the edge of the envelope.
When to trust which
| Situation | Lean on | Why |
|---|---|---|
| Planning a flight for tomorrow | Forecast | Only the forecast looks ahead. |
| Deciding in the next hour or two | Observation first, forecast for context | The observation shows what the model got right or wrong today. |
| Station close, recent, similar altitude, open terrain | Observation | It measures the same air mass you'll fly in. |
| Station far away, across a ridge or on the coast while you're inland | Forecast (with caution) | The station is measuring different weather. |
| Calm at the station in early morning | Forecast at height | An inversion can hide strong wind aloft. |
| Showers or thunderstorms around | Radar and observations | Models place convective cells poorly; stations and radar see them. |
A useful rule: when observation and forecast disagree, the observation wins for the next hour or two — as long as the station genuinely represents your site.
Is the station representative?
Check three things before you trust a station over the forecast:
- Distance. Within about 20–25 km in open, flat country; much less in mountains or on a coastline.
- Altitude. A station 300 m lower or higher than your site sits in different air. In an Alpine valley the airport may be calm while the ridge you're flying from is in a strong flow.
- Age. A report from two hours ago may describe weather that has already moved on.
The comparison tool checks all three for you and says when the station is a poor stand-in.
What about a personal weather station?
A home or club weather station — Tempest, Ecowitt, Ambient Weather, Davis and others — can be closer to where you fly than any airport. It can also be misleading if it's badly placed:
- Mounting height and exposure matter more than the brand. An anemometer on a roof edge, in a garden surrounded by trees or next to a wall can read half the real wind, or double it in a gap between buildings.
- Official stations are sited to a standard; most personal stations aren't. Compare yours with the nearest airport on a windy day to see how it behaves.
- It still measures only one point near the ground. It tells you nothing directly about the wind at 120 m.
Used well, a personal station at your flying field is the best local cross-check there is — just treat it as "wind at this spot, at this height", not as the wind your drone will meet.
Neither is a measurement at flying height
Everything above is measured or forecast near the ground. The wind at 100–120 m is often 1.5–2 times stronger and can blow from a different direction. Use the observation to judge whether the forecast is running high or low today, then apply that to the forecast at height — see why wind can be stronger at 120 m and the Wind at Altitude tool.
FAQ
Why does the forecast so often under-predict gusts?
Gusts are small, short-lived eddies that a model grid can't resolve; forecast gusts are a statistical estimate. Stations measure the actual peak, so measured gusts are often higher, especially near terrain or in showers.
Is an airport METAR accurate enough for drone flying?
As a measurement of the airport, yes — it's among the best available. As a measurement of your site, it depends on distance, terrain and altitude. It is most valuable as a check on whether the forecast is right today.
Should I buy a weather station for my drone operations?
If you fly repeatedly from the same site — a club field, a farm, an inspection site — a well-sited station gives you a real local record. Mount the anemometer as high and as clear of obstacles as you can, and compare it with an official station to learn its bias.
Related: how wind affects drone ground speed, wind speed vs gusts and why weather apps show different wind forecasts.
Sources
- World Meteorological Organization, Guide to Instruments and Methods of Observation (WMO-No. 8) — standard exposure of wind instruments at 10 m.
- NOAA Aviation Weather Center, Data API — METAR observations used by the comparison tool.
- Forecast data: Open-Meteo, as listed on our Data Sources page.
This guide is general information for planning, not aviation regulation.